Introduction
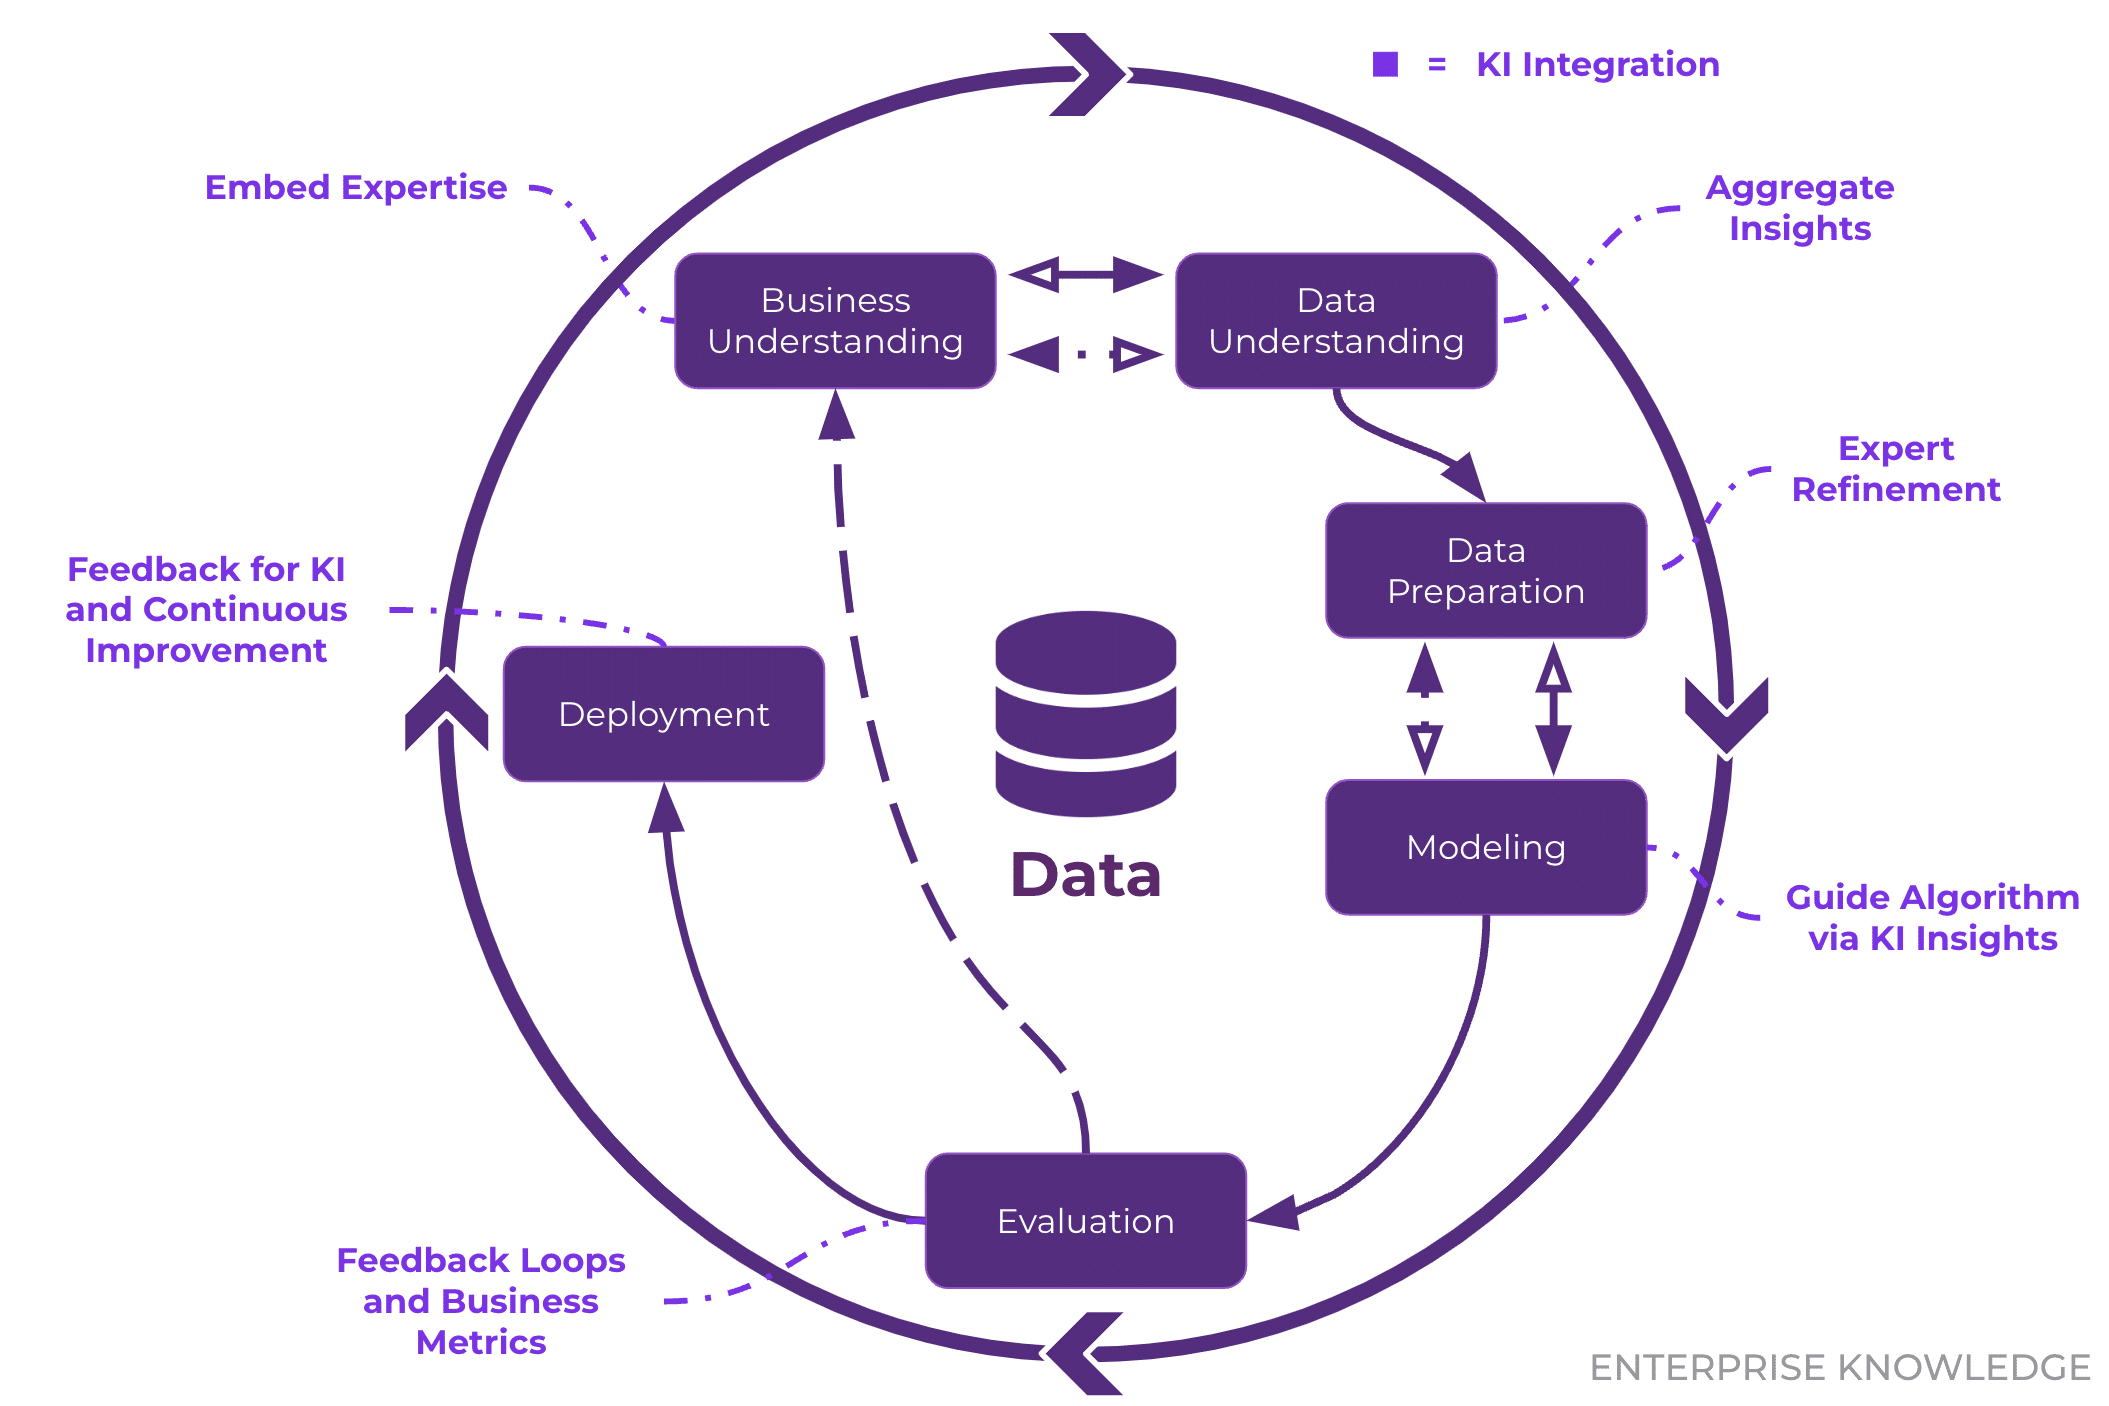
The Cross-Industry Standard Process for Data Mining (CRISP-DM) is the gold standard for structuring data science and data mining projects. Developed to provide a systematic approach, CRISP-DM transforms raw data into actionable insights or predictive models through six iterative phases: Business Understanding, Data Understanding, Data Preparation, Modeling, Evaluation, and Deployment. In 2025, CRISP-DM remains widely adopted due to its flexibility and applicability across industries like finance, healthcare, and marketing. This guide explores each phase with practical Python examples, best practices, and real-world applications, empowering data professionals to execute successful projects.
The Six Phases of CRISP-DM
1. Business Understanding
Objective: Define the project’s goals and align them with business needs.
This phase focuses on understanding the problem, identifying stakeholders, and setting clear objectives. It ensures the data science project delivers value to the organization.
Key Tasks:
- Identify the business problem (e.g., reduce customer churn, optimize pricing).
- Define data science objectives (e.g., predict churn, segment customers).
- Develop a project plan with timelines and resources.
Example: A retail company wants to reduce customer churn by 10%. The data science goal is to build a predictive model identifying at-risk customers.
Python Example: Defining Objectives
# Document project objectives
project_plan = {
    "business_goal": "Reduce customer churn by 10% in 6 months",
    "data_science_goal": "Build a predictive model to identify at-risk customers",
    "metrics": ["accuracy", "precision", "recall"],
    "timeline": "3 months"
}
print(project_plan)
2. Data Understanding
Objective: Collect and explore data to gain insights and identify quality issues.
This phase involves gathering data, describing its structure, and exploring relationships to understand its suitability for the project.
Key Tasks:
- Collect initial datasets from sources like databases or APIs.
- Analyze data structure, types, and summary statistics.
- Identify missing values, duplicates, or anomalies.
- Visualize relationships using tools like Matplotlib or Seaborn.
Example: Analyzing customer data to understand churn patterns.
Python Example: Data Exploration
import pandas as pd
import matplotlib.pyplot as plt

# Load data
df = pd.read_csv('customer_data.csv')

# Display summary
print(df.info())
print(df.describe())
print(df.isnull().sum())

# Visualize churn distribution
df['churn'].value_counts().plot(kind='bar', color=['#1f77b4', '#ff7f0e'])
plt.title('Churn Distribution')
plt.xlabel('Churn')
plt.ylabel('Count')
plt.show()
This code loads customer data, summarizes it, and visualizes churn distribution to identify imbalances.
3. Data Preparation
Objective: Create a clean, structured dataset for modeling.
This phase involves cleaning, transforming, and selecting data to ensure it’s ready for analysis or modeling.
Key Tasks:
- Handle missing values (imputation or removal).
- Remove duplicates and outliers.
- Transform data (e.g., encoding, scaling, feature engineering).
- Split data into training and test sets.
Example: Preparing customer data by encoding categories and normalizing numerical features.
Python Example: Data Cleaning and Transformation
# Handle missing values
df['age'] = df['age'].fillna(df['age'].mean())
df['plan_type'] = df['plan_type'].fillna(df['plan_type'].mode()[0])

# Remove duplicates
df = df.drop_duplicates()

# Encode categorical variables
df = pd.get_dummies(df, columns=['plan_type'], prefix='plan')

# Normalize numerical features
df['tenure'] = (df['tenure'] - df['tenure'].min()) / (df['tenure'].max() - df['tenure'].min())

# Split data
from sklearn.model_selection import train_test_split
X = df.drop('churn', axis=1)
y = df['churn']
X_train, X_test, y_train, y_test = train_test_split(X, y, test_size=0.2, random_state=42)
This prepares the dataset by handling missing values, encoding categories, normalizing features, and splitting data.
4. Modeling
Objective: Build and train machine learning models to address the business problem.
This phase involves selecting appropriate algorithms, tuning hyperparameters, and training models.
Key Tasks:
- Choose algorithms (e.g., logistic regression, random forest).
- Tune hyperparameters using grid search or random search.
- Train and evaluate models on training/test data.
Example: Training a random forest model to predict customer churn.
Python Example: Model Training
from sklearn.ensemble import RandomForestClassifier
from sklearn.metrics import accuracy_score, classification_report

# Train model
model = RandomForestClassifier(n_estimators=100, random_state=42)
model.fit(X_train, y_train)

# Predict and evaluate
y_pred = model.predict(X_test)
print(f"Accuracy: {accuracy_score(y_test, y_pred):.2f}")
print(classification_report(y_test, y_pred))
This trains a random forest model and evaluates its performance using accuracy and detailed metrics.
5. Evaluation
Objective: Assess whether the model meets business objectives and is statistically sound.
This phase ensures the model delivers actionable results and identifies areas for improvement.
Key Tasks:
- Compare model performance to business goals.
- Validate results using metrics like precision, recall, or F1-score.
- Identify limitations or biases in the model.
Example: Verifying if the churn prediction model meets the 85% precision target.
Python Example: Model Evaluation
from sklearn.metrics import confusion_matrix
import seaborn as sns

# Confusion matrix
cm = confusion_matrix(y_test, y_pred)
sns.heatmap(cm, annot=True, fmt='d', cmap='Blues')
plt.title('Confusion Matrix')
plt.xlabel('Predicted')
plt.ylabel('Actual')
plt.show()

# Check if business goal is met
precision = classification_report(y_test, y_pred, output_dict=True)['1']['precision']
print(f"Precision for churners: {precision:.2f}")
This visualizes the model’s performance and checks if it meets the precision target.
6. Deployment
Objective: Integrate the model into business processes for real-world use.
This phase involves deploying the model, automating predictions, and monitoring performance over time.
Key Tasks:
- Integrate the model into production systems (e.g., CRM via API).
- Automate predictions with tools like Flask or FastAPI.
- Monitor model drift and retrain as needed.
Example: Deploying the churn model in a CRM system to flag at-risk customers.
Python Example: Model Deployment with Flask
from flask import Flask, request, jsonify
import pickle

app = Flask(__name__)

# Charge the model
with open('churn_model.pkl', 'rb') as f:
    model = pickle.load(f)

@app.route('/predict', methods=['POST'])
def predict():
    data = request.get_json()
    features = [data['age'], data['tenure'], data['plan_basic'], data['plan_premium']]
    prediction = model.predict([features])[0]
    return jsonify({'churn_prediction': int(prediction)})

if __name__ == '__main__':
    app.run(debug=True)
This creates a simple API endpoint to serve churn predictions, deployable in a CRM system.
CRISP-DM in Action: Real-World Applications
CRISP-DM is applied across industries:
- Finance: Predicting loan defaults or detecting fraud.
# Example: Fraud detection preprocessing
df['transaction_amount'] = df['transaction_amount'].clip(lower=0)
- Healthcare: Forecasting patient readmissions.
- Retail: Segmenting customers for targeted marketing.
- Manufacturing: Predicting equipment failures using IoT data.
Challenges and Best Practices
Challenges:
- Scope Creep: Business Understanding may shift without clear objectives.
- Data Quality: Poor data in Data Understanding can derail modeling.
- Model Drift: Deployed models may degrade over time, requiring monitoring.
Best Practices:
- Iterate: Revisit earlier phases if issues arise (e.g., new data needs in Modeling).
- Document: Record decisions and code for reproducibility.
- Collaborate: Engage stakeholders throughout to align with business needs.
- Automate: Use pipelines for Data Preparation and Deployment to save time.
Example: Automated Pipeline
from sklearn.pipeline import Pipeline
from sklearn.preprocessing import StandardScaler

# Create pipeline
pipeline = Pipeline([
    ('scaler', StandardScaler()),
    ('model', RandomForestClassifier())
])

# Train pipeline
pipeline.fit(X_train, y_train)
This automates scaling and modeling, streamlining the process.
CRISP-DM Visual Schematic
Here’s a simplified ASCII representation of the CRISP-DM process:
Conclusion
CRISP-DM provides a structured yet flexible framework for data science projects, guiding practitioners from business problem definition to model deployment. Its six phases—Business Understanding, Data Understanding, Data Preparation, Modeling, Evaluation, and Deployment—ensure projects are aligned with business goals and grounded in robust data practices. By leveraging Python tools like Pandas, scikit-learn, and FastAPI, you can implement CRISP-DM efficiently, as shown in the examples above. Whether you’re predicting customer churn, detecting fraud, or optimizing operations, CRISP-DM offers a roadmap to success. Start applying it to your projects, explore open-source datasets on Kaggle, and refer to the official CRISP-DM documentation for deeper insights.
Comments
No comments yet. Be the first to share your thoughts!